Bill Morris on Austin Real Estate
Latest Post
Looking for Change
I have written extensively in recent months about the difficult market conditions we’re facing in Austin-area residential real estate in 2025. (See Austin Real Estate 2025: Market Shift Explained and Fall 2025: A Shift to Buyer-Friendly Real Estate) All of this very long market cycle, which began in 2013, has been characterized by very low listing inventory relative to previous cycles, driven by enormous population growth and housing demand. 2020, 2021, and 2022 were an unprecedented turning point, during which sales outpaced the addition of new listings for 18 of 20 months!
Very real and lasting distortion of our market environment persists even now. I have shared this chart from my Market Dashboard in previous posts:
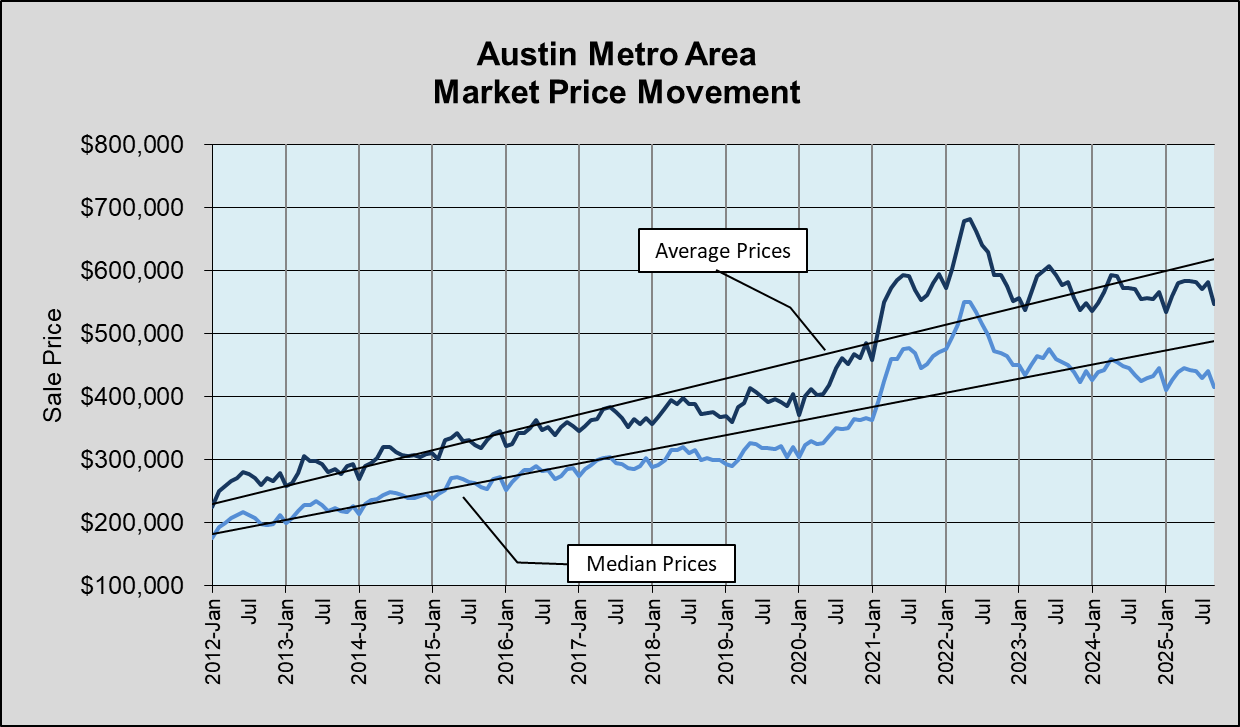
The first peak of median and average prices during that time occurred in July 2021, but competition among increasingly frustrated buyers drove prices much higher by May 2022. The frenzy among buyers and extreme price elasticity benefiting sellers delayed recognition of the dramatic increase in inventory. This chart shows that change:
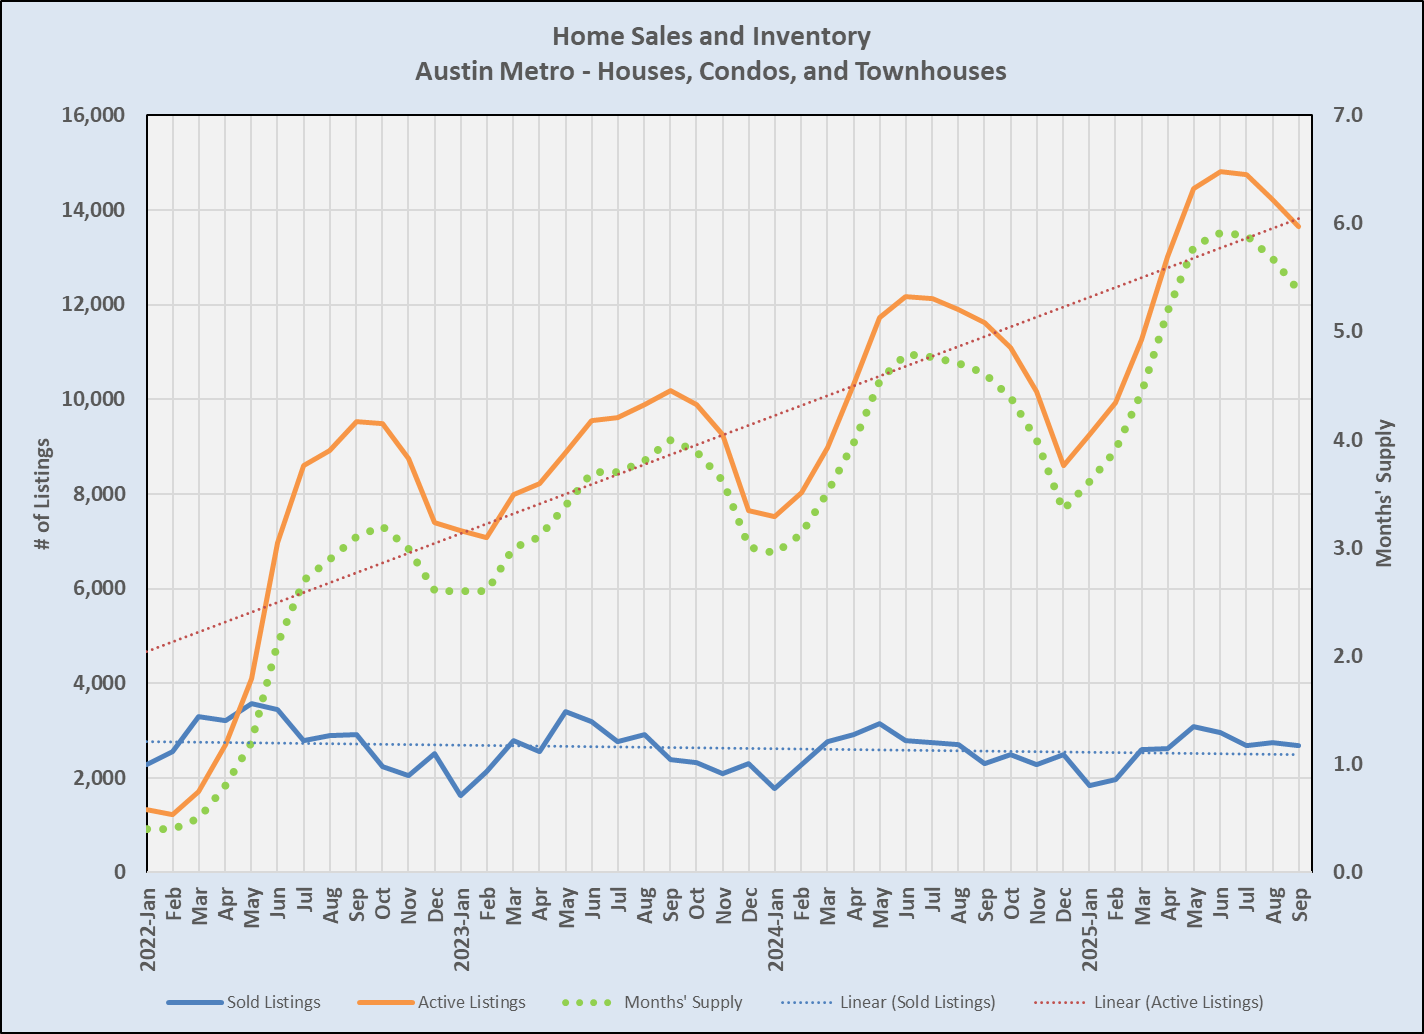
Between February 2022 and September 2022 — just eight months — the number of active listings exploded from 2,516 to 9,523. The number of sales declined seasonally in the second half of 2022 and rose again in early 2023, but the trend of sales has continued to fall slowly. By June 2025, listing inventory totalled almost 15,000, with the number of closed sales lower than the peaks in 2022, 2023, and 2024.
It’s worth noting in the chart above that listing inventory across the Austin metropolitan area remains at or a little below 6 months’ supply — the level that our industry has long considered “normal.” For ten prior years, though, inventory was at or below 3 months. Many home owners and home buyers (and most real estate agents) had never experienced that “normal” environment.
A more telling statistic is the ratio of final sale prices to original list prices:
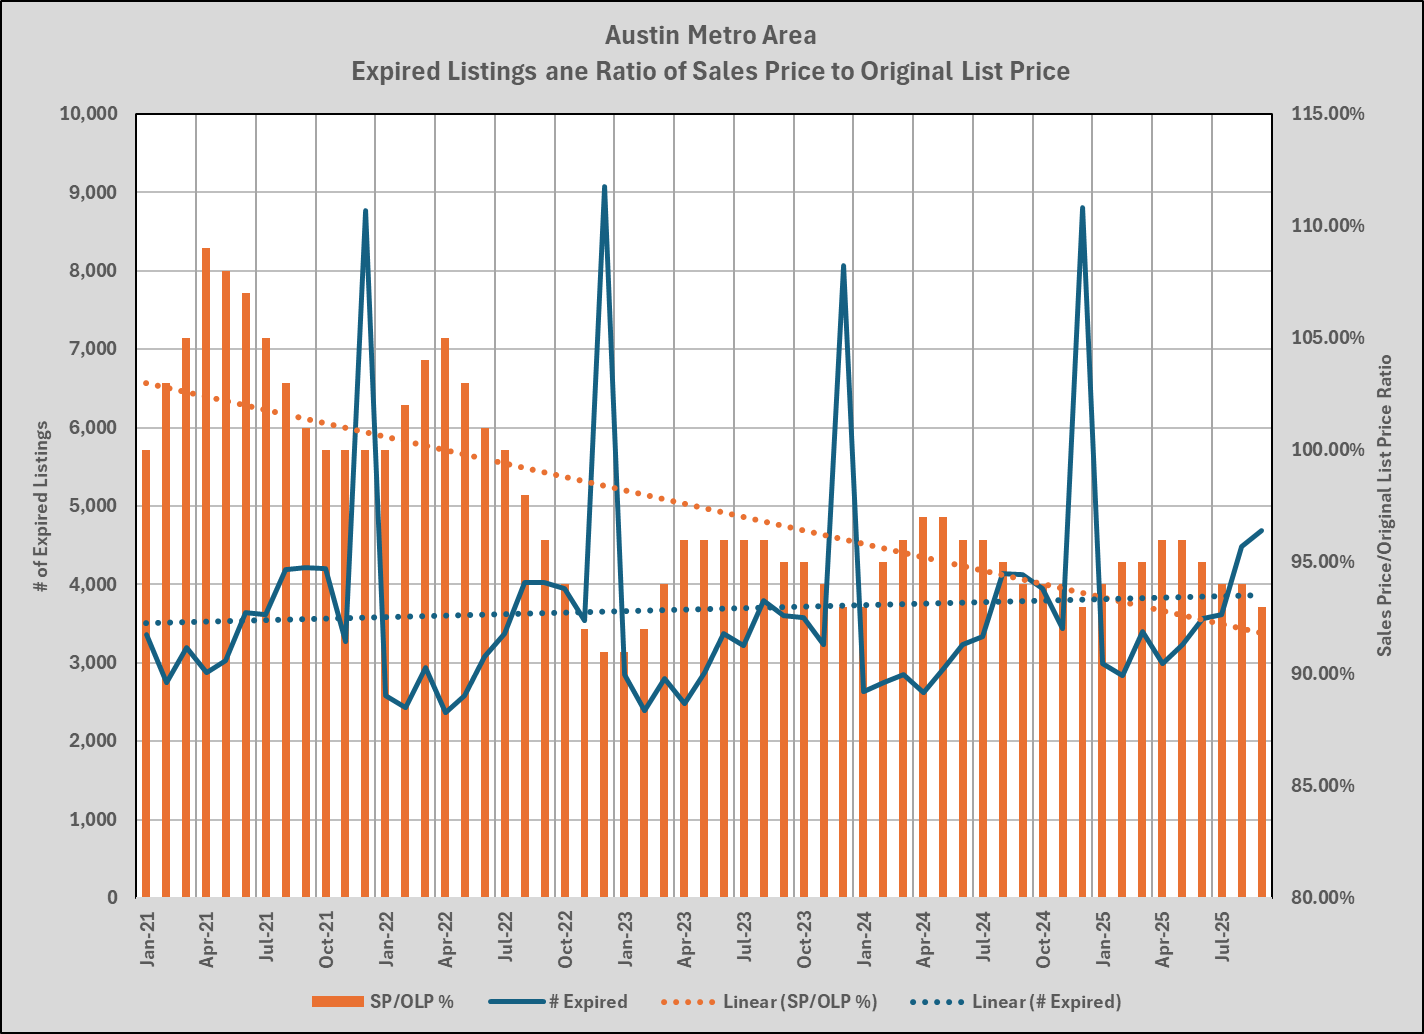
The slow increase in the number of expired listings was almost imperceptible, but the Sale Price/Original List Price ratio fell:
— from 109% in April 2021 to 100% in October 2021, then
— from 105% in April 2022 to 91% in December 2022.
That ratio has remained below 100% for more than three years now, with many sellers stubbornly resisting the change in market momentum.
This shift in market behavior was complicated by other factors: (1) Average and median home prices in the Austin area remain below their 2022 peaks, so home owners who purchased in 2021 or later may have paid more than their homes will sell for now, and (2) mortgage interest rated are about twice what they were for many years earlier in this market cycle, so many prospective buyers who would have qualified in 2021 may still find home ownership out of reach now.
I have commented in previous posts about unpredictable price behavior in 2025. the updated chart shows that what looked like the start of recovery early in the year has been almost totally reversed in recent months:
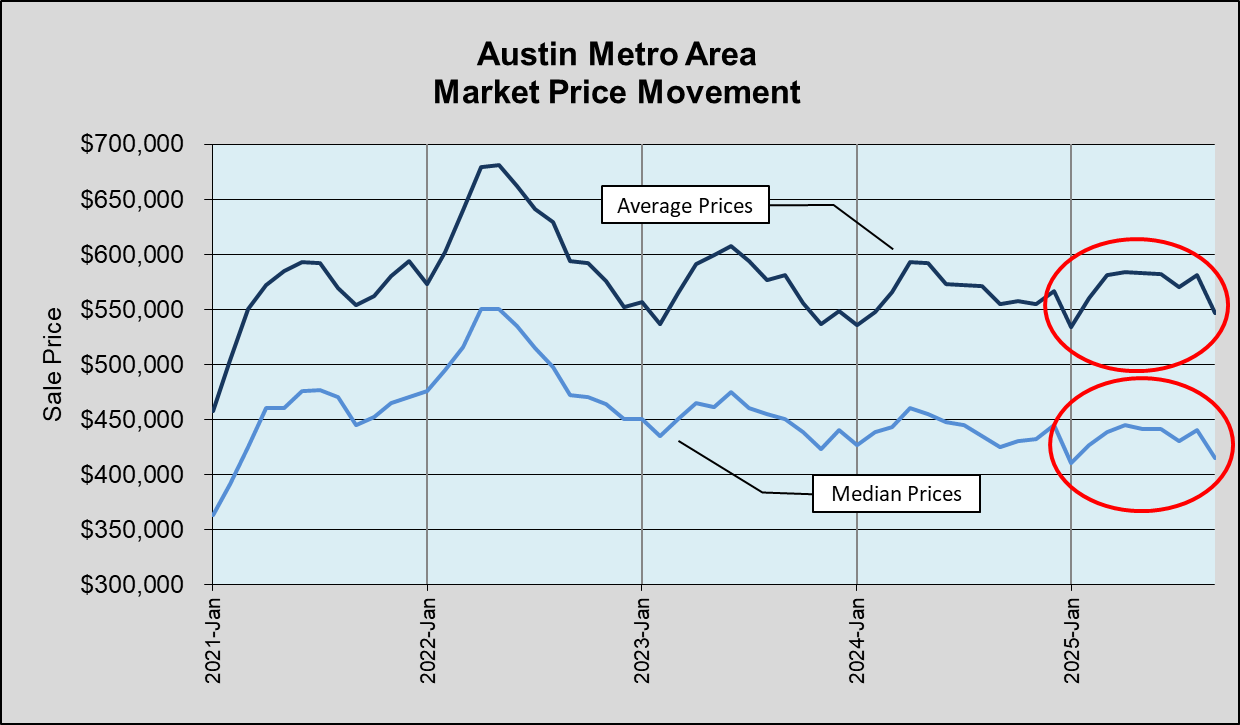
I began this look at our market environment to look for signs of positive change in our environment, but I’m sorry to say that I don’t see them yet. In the first chart above (Market Price Movement) you can see that average and median sale prices are flat to slightly down over the past three years. In 2025, prices rose very early in the year, but we did not see a persistently positive trend.
As always, I’m active in our market every day, and I study conditions constantly. Homes are still selling, but sellers are not in control and many buyers are uncertain about the future. This part of our market cycle will pass, but I don’t see indications that we are there yet.
